Solar System Performance Analytics: Maximize Your Energy
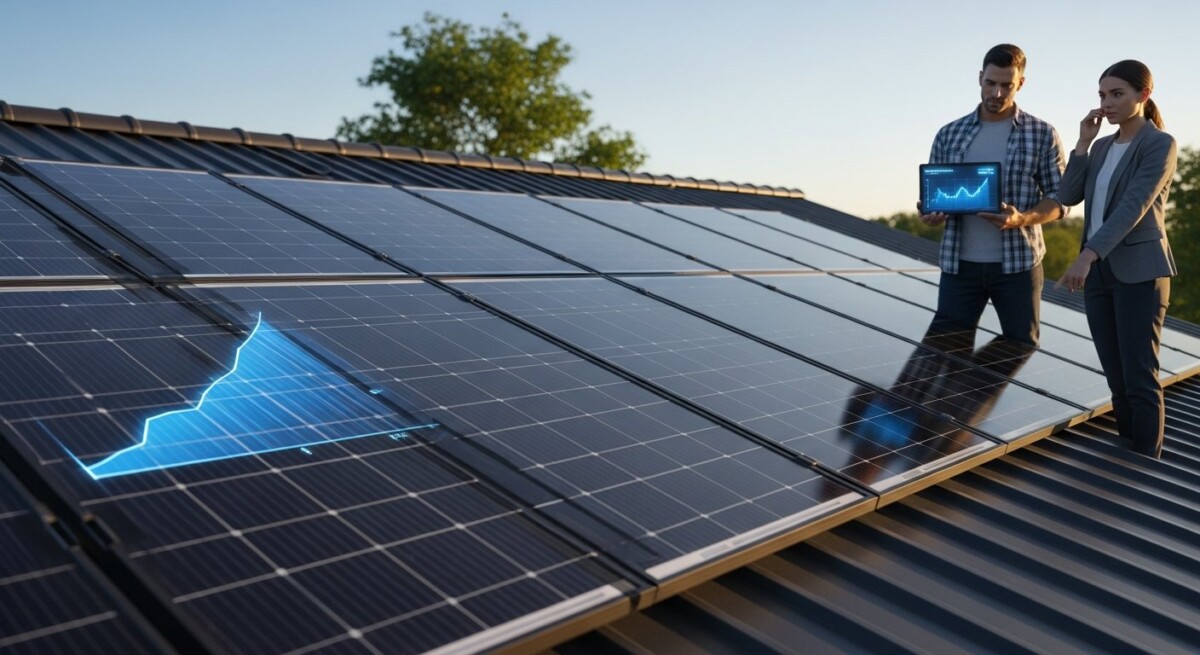
Your solar panels sit quietly on the roof, soaking up sunlight day after day. But are they performing at their peak? Without a clear view into your system’s actual output, you might be losing hundreds of dollars in missed energy credits each year. Solar system performance analytics gives you that visibility: a data-driven approach to monitoring, measuring, and optimizing every watt your array produces. This article explains what these analytics cover, how to interpret your data, and why proactive monitoring is the key to maximizing your return on investment.
What Is Solar System Performance Analytics?
Solar system performance analytics is the practice of collecting and analyzing data from your photovoltaic (PV) system to evaluate its efficiency, identify underperformance, and predict future energy production. Think of it as a health dashboard for your solar investment. Instead of guessing whether everything is working, you get precise metrics on energy output, panel temperature, inverter status, and environmental conditions.
Modern analytics platforms pull data from inverters, meters, and sometimes individual panel-level optimizers or microinverters. They compare your actual generation against expected benchmarks based on weather data, panel specifications, and historical trends. This comparison reveals issues like shading from new tree growth, dirt accumulation, inverter faults, or wiring problems before they become costly failures. For homeowners and business owners alike, this intelligence transforms solar from a set-it-and-forget-it purchase into a managed asset that delivers consistent, predictable returns.
Key Metrics That Define System Health
To truly understand your system’s performance, you need to track more than just the total kilowatt-hours produced. The following metrics provide a complete picture of how well your solar installation is operating relative to its design and environmental conditions.
Performance Ratio (PR)
Performance ratio is the solar industry’s gold standard for efficiency measurement. It compares the actual energy output to the theoretical output your system would generate under ideal conditions. A PR of 80% or higher is considered excellent for most residential systems. Values below 70% signal that something is draining your production: excessive heat, inverter clipping, partial shading, or component degradation. By tracking PR monthly, you can spot gradual declines that might otherwise go unnoticed until your electricity bill spikes.
Specific Yield (kWh/kWp)
Specific yield measures how many kilowatt-hours each kilowatt of installed capacity produces over a given period. For example, if you have a 6 kW system that generates 9,000 kWh annually, your specific yield is 1,500 kWh/kWp. This metric standardizes performance across different system sizes, making it easy to compare your installation against regional averages. Most U.S. regions see specific yields between 1,200 and 1,600 kWh/kWp, depending on sunlight hours, weather, and panel orientation.
Inverter Efficiency and Uptime
Your inverter is the brain of the system, converting DC electricity from panels into usable AC power for your home. Analytics track inverter efficiency (typically 96-99%) and uptime (percentage of time the inverter operates without error). A sudden drop in efficiency or repeated fault codes often indicates an impending hardware failure. Catching these early can save you from weeks of lost production while waiting for repairs. Most modern inverters log these data points automatically, feeding them into your monitoring platform for real-time alerts.
How to Collect and Analyze Performance Data
Gathering the right data does not require a PhD in electrical engineering. Most solar systems sold today include a monitoring gateway or app that provides basic production figures. However, to perform robust solar system performance analytics, you may need to go a step further. Here is a practical framework for setting up your own analytics process.
First, ensure your monitoring hardware captures data at least every 15 minutes. Coarse data (daily totals only) hides short-term issues like inverter shutdowns during peak sun hours. Second, integrate weather data from a local station or satellite feed so you can normalize your production against actual sunlight conditions. Third, establish baseline benchmarks during your system’s first year of operation, when panels are clean and components are new. Compare subsequent years against this baseline to detect degradation or damage.
- Check inverter logs weekly: Look for error codes, unusual voltage readings, or patterns of disconnection. Most inverter manufacturers publish a list of common fault codes online.
- Monitor string currents monthly: If your system uses string inverters, each string should produce similar current. A string that drops 20% or more relative to others likely has a shaded or failed panel.
- Review production against weather forecasts: After a cloudy week, compare your actual output to the expected production for those conditions. Sustained underperformance on clear days is a red flag.
- Schedule professional inspections annually: A technician can verify wiring integrity, test panel output with an IV curve tracer, and clean any debris you cannot safely reach.
Following this routine helps you catch issues early. For instance, one homeowner noticed a 15% drop in a single string’s current during a routine monthly check. A technician discovered a rodent had chewed through the wiring under a panel. The repair cost $150, but catching it early prevented weeks of production loss that would have cost over $400 in missed credits.
Common Performance Issues and How Analytics Reveal Them
Even well-installed solar systems experience problems over their 25- to 30-year lifespan. Solar system performance analytics acts as an early warning system for the following common issues.
Partial Shading and Soiling
Shading from nearby trees, new construction, or even a single fallen leaf can dramatically reduce output. Analytics detect this by showing a disproportionate drop in production during specific times of day or after weather events. For example, if your system normally produces 30 kWh on a sunny June day but suddenly drops to 22 kWh while your neighbor’s system stays steady, something is casting a shadow. Similarly, soiling from dust, bird droppings, or pollen accumulates gradually. A performance ratio that declines 2-3% per month without rain points to a dirty array that needs cleaning.
Inverter Clipping and Overheating
Inverter clipping occurs when your panels produce more DC power than the inverter can handle, causing the inverter to cap its output. Some clipping is normal on the best days, but excessive clipping indicates an undersized inverter. Analytics show this as a flat-topped production curve during midday hours. Overheating, on the other hand, reduces voltage and efficiency. A performance ratio that dips on hot afternoons but recovers in the evening suggests your panels or inverter are running too hot. Proper ventilation and panel tilt can mitigate this.
Component Degradation
Solar panels degrade at about 0.5-0.8% per year, according to industry standards. However, manufacturing defects or environmental stress can accelerate this. Analytics detect abnormal degradation by comparing year-over-year specific yield under similar weather conditions. If your system’s output declines 3% in one year instead of the expected 0.7%, a panel or connection may be failing. Many monitoring platforms can pinpoint which panel or string is underperforming, allowing targeted replacement rather than whole-system troubleshooting.
Using Analytics to Optimize Your Solar Investment
Performance data is not just for troubleshooting; it is a strategic tool for maximizing financial returns. When you understand exactly how your system behaves, you can make informed decisions about upgrades, maintenance schedules, and even electricity usage habits.
For instance, if your analytics show consistent clipping during summer afternoons, you might consider adding a second inverter or replacing your existing one with a larger model. If your specific yield is lower than regional averages because of morning shading, you could trim trees or adjust panel tilt angles. Every improvement directly increases your savings, shortening your payback period. In our guide on AI solar system comparison to maximize your home savings, we explain how to evaluate these upgrade options side by side.
Additionally, analytics help you time high-energy activities. If your system produces peak power between 10 a.m. and 2 p.m., running your pool pump, dishwasher, or EV charger during that window maximizes self-consumption and reduces grid purchases. Many smart home systems can automate this based on real-time production data from your analytics platform.
Choosing an Analytics Platform or Service
Not all monitoring tools are built alike. As you explore options for solar system performance analytics, look for platforms that offer the following capabilities to ensure you get actionable insights rather than just raw numbers.
First, prioritize platforms that provide panel-level monitoring. String-level data hides individual panel failures, while module-level monitoring (via microinverters or power optimizers) shows exactly which panel is underperforming. Second, choose a service with automatic alerts for anomalies. You do not want to manually check dashboards every day; an email or text alert when production drops below a threshold saves time and money. Third, consider platforms that integrate with your utility’s net metering data, so you can verify that your credits match your production.
For homeowners seeking a professional-grade solution, the AI solar system comparison to maximize your savings tool on this site can help match your specific system configuration with the best monitoring and analytics services available. This ensures you get a platform tailored to your inverter brand, panel type, and usage patterns.
When to Call a Professional
While many homeowners can handle basic analytics monitoring, certain situations require expert intervention. If your performance ratio drops below 70% for more than two consecutive months, if you see repeated inverter fault codes like ground fault or arc fault, or if your specific yield falls more than 10% below regional averages, it is time to call a certified solar technician. Professional diagnostics using IV curve tracing, thermal imaging, and electrical testing can identify issues that standard monitoring misses, such as micro-cracks in panels or faulty bypass diodes.
Also, be aware that some inverter manufacturers void warranties if you attempt certain repairs yourself. Always consult your system documentation before opening any electrical components. A qualified technician can perform analytics-driven troubleshooting without risking your warranty coverage.
Future Trends in Solar Performance Analytics
The field is evolving rapidly. Artificial intelligence and machine learning are now being applied to solar data to predict failures before they happen. For example, AI models can analyze thousands of data points from your inverter and compare them against failure patterns from millions of other systems worldwide. When the model detects a 90% probability of inverter failure within the next 30 days, it alerts you to schedule a replacement during a planned outage, rather than dealing with an unexpected shutdown.
Blockchain-based verification is also emerging, allowing homeowners to prove their renewable energy production to utilities or carbon credit markets with tamper-proof data. These innovations will make solar system performance analytics even more valuable, transforming solar panels from passive energy generators into active, intelligent assets that communicate with the grid and optimize their own operation.
By embracing solar system performance analytics today, you position yourself to benefit from these advances while protecting your current investment. The data you collect now becomes the training set for tomorrow’s smarter algorithms. Start monitoring, start analyzing, and start maximizing every ray of sunlight your panels capture.
Your solar system holds immense potential. With the right analytics, you can unlock every watt of that potential, ensuring your investment pays dividends for decades to come. Whether you are a new solar owner or a seasoned veteran, committing to ongoing performance analysis is the single most effective step you can take to protect your energy independence and financial returns.