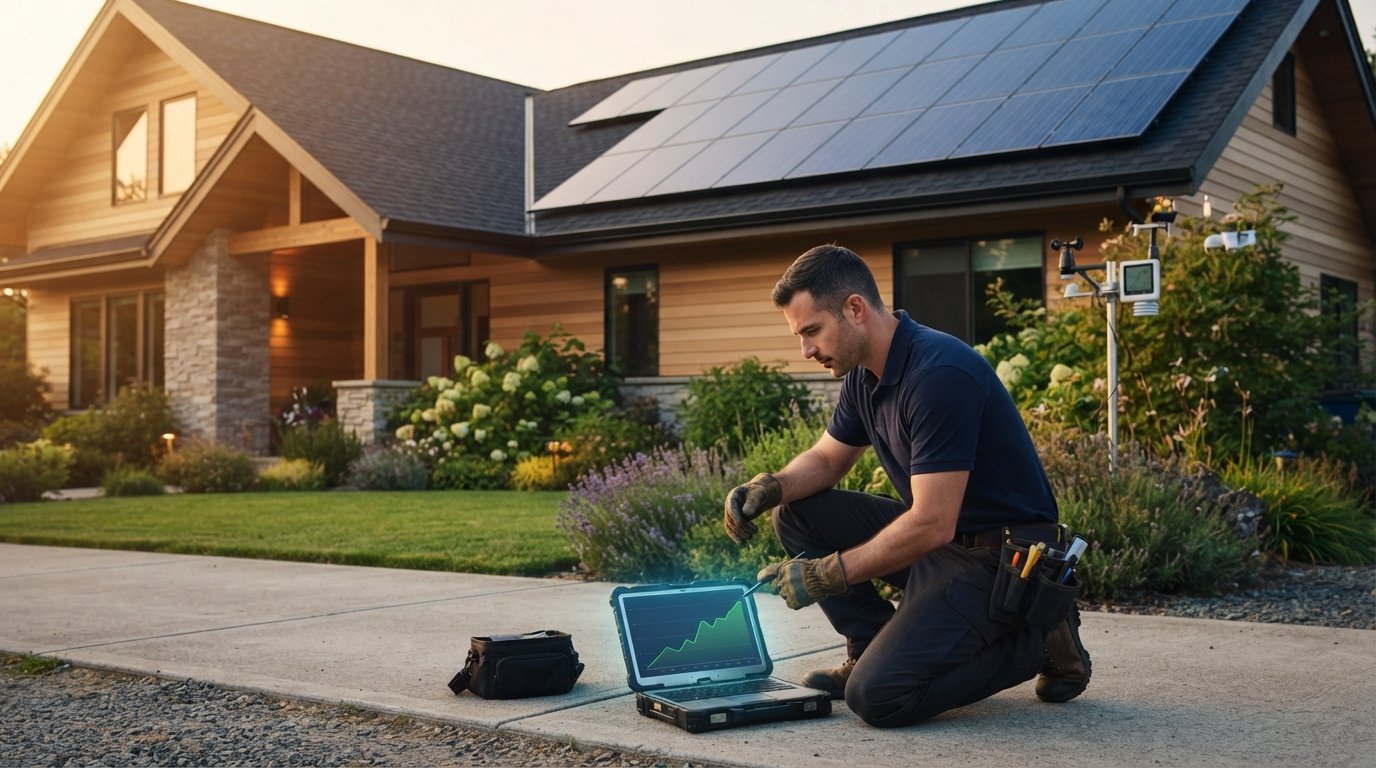
Solar Performance Analytics: Maximize Your Savings
Solar performance analytics helps you catch underperformance early, cut wasted energy, and maximize your solar savings.

By Owen Phillips
Learn more about Solar Panel Installation and Repair for guides, costs, and what to expect.
Compare Solar Panel Installation and Repair Pros Near You

Enter your ZIP code to compare top-rated local professionals and request free quotes.
Your solar panels are working every day, but are they performing at their best? A 10% drop in output can quietly cost you hundreds of dollars each year, yet most homeowners never notice. Solar performance analytics changes that by turning raw system data into clear, actionable insights. With the right monitoring tools and a bit of know-how, you can catch underperformance early, protect your investment, and squeeze every kilowatt-hour of savings from your array. This guide shows you exactly how to read your system's health, spot trouble, and act before small problems become expensive repairs.
What Is Solar Performance Analytics and Why It Matters Now
Solar performance analytics is the practice of collecting, measuring, and interpreting data from your photovoltaic system. It goes far beyond a simple energy meter reading. Modern analytics platforms track inverter output, panel-level production, weather conditions, shading patterns, and even the degradation rate of individual modules. By comparing your system's actual output against expected performance, these tools flag anomalies that indicate dirt buildup, wiring faults, or component failures.
The importance of this discipline has grown as solar adoption has skyrocketed. According to the Solar Energy Industries Association, the United States has enough installed solar to power over 23 million homes. Yet many of those systems operate below peak efficiency without their owners knowing. A study from the National Renewable Energy Laboratory found that typical performance losses due to undetected faults range from 5% to 15% of annual production. For a homeowner paying an average electricity rate of $0.17 per kWh, a 10% loss on an 8 kW system means roughly $200 to $300 in wasted savings each year. Over a 25-year system life, that unused energy can amount to thousands of dollars.
Thankfully, the barrier to entry for solar performance analytics has never been lower. Most modern inverters include built-in monitoring, and standalone sensors can retrofit older systems. These tools translate complex data into simple dashboards that show you exactly how your investment is performing. Whether you are a new solar owner or a veteran, understanding these metrics is the key to keeping your panels profitable.
Key Metrics That Define Solar System Health
To make sense of your solar data, you need to focus on a handful of core performance indicators. These numbers act as a health check for your entire system, revealing whether you are getting the most from your panels or leaving savings on the table.
Performance Ratio (PR)
Performance ratio is the gold standard for solar health. It measures the ratio of actual energy output to the theoretical output based on your system's nameplate capacity and the solar irradiance at your location. A PR of 0.85 means your system is delivering 85% of what it should under ideal conditions. Most healthy systems operate between 0.75 and 0.90. A PR consistently below 0.70 signals a problem that needs investigation.
Specific Yield (kWh/kWp)
Specific yield tells you how many kilowatt-hours your system generates for each kilowatt of installed capacity. For example, a 6 kW system producing 9,000 kWh in a year yields 1,500 kWh/kWp. This metric is location-dependent, but it gives you a quick benchmark against regional averages. If your yield drops year over year without an obvious cause, it may point to panel degradation or shading changes.
Inverter Efficiency and Downtime
Your inverter is the brain of the system, converting DC power from panels into AC power for your home. Monitoring its efficiency is critical because inverter failures are the most common cause of total system outages. Analytics platforms track how often your inverter trips, how long it stays offline, and whether it is operating within its optimal temperature range. A sudden rise in downtime events is a red flag that warrants immediate attention.
Irradiance and Weather Correlation
Solar output naturally varies with weather, so analytics tools compare your production against local irradiance data. This correlation helps distinguish between a cloudy week and an actual system fault. For instance, if your panels produce 30% less than expected despite clear skies, you likely have a performance issue rather than a weather issue.
These metrics do not exist in isolation. A well-designed analytics dashboard combines them into an at-a-glance score that tells you whether your system is healthy, needs attention, or is failing. When you understand these numbers, you can take proactive steps to maintain peak performance.
How to Monitor Your Solar System Like a Pro
Monitoring your solar system no longer requires a degree in electrical engineering. With the right tools and a simple routine, you can track performance confidently and catch problems before they drain your savings.
Start by choosing a monitoring platform that fits your system. Many inverters, such as those from Enphase, SolarEdge, and Fronius, come with manufacturer apps that offer basic analytics. These apps typically show daily production, historical trends, and error alerts. For more advanced insights, third-party platforms like Sense or Solar Analytics provide deeper data, including panel-level monitoring and predictive maintenance alerts. If you are working with a solar installer, ask whether they offer remote monitoring as part of their service package.
Once your monitoring is set up, follow this simple weekly routine to stay on top of your system's health:
- Check your dashboard's daily production and compare it to the forecasted output for your location and time of year.
- Review any alerts or error codes from your inverter or monitoring app. Address these immediately if they indicate a fault.
- Look at your performance ratio trend. A steady decline over several weeks is more concerning than a one-day dip.
- Inspect your panels visually for obvious debris, bird droppings, or shading from new tree growth, and note any changes.
- Once a month, export your production data and calculate your specific yield to ensure it is within the expected range for your region.
This routine takes just minutes, but it creates a habit of vigilance that pays off. Homeowners who monitor regularly are more likely to catch early signs of inverter failure or soiling, both of which can be fixed cheaply if addressed promptly. In fact, a study by the University of California found that homes with active monitoring systems recovered an average of 3.6% more energy than those without, simply because issues were resolved faster.
For those who prefer a hands-off approach, professional monitoring services can handle the data analysis for you. These services often include automatic alerts and scheduled inspections, giving you peace of mind without the weekly check-in. The cost is usually modest compared to the potential savings from avoiding prolonged underperformance.
Using Analytics to Detect and Fix Underperformance
When your analytics show a drop in output, the cause can range from trivial to severe. The key is to diagnose systematically rather than panic. Here is a breakdown of the most common culprits and how to address them.
Soiling and Dirt Buildup
Dust, pollen, and bird droppings can block sunlight and reduce output by up to 25% in dusty areas. Your analytics will show a gradual decline in performance ratio, especially after dry spells. The fix is simple: clean your panels with water and a soft brush, or hire a professional cleaning service. In most regions, rainfall provides enough cleaning, but in arid climates or near construction sites, manual cleaning may be needed once or twice a year.
Shading from New Obstructions
Trees grow, and neighbors build additions. New shading can cause a disproportionate loss because even a small shadow on one panel can affect the entire string. Analytics that show a specific time-of-day pattern in production drops can help you identify the source. Trimming branches or adjusting panel tilt may resolve the issue, but sometimes the only fix is to relocate the affected panels.
Inverter Faults and Communication Errors
Inverters are electronic devices, and they do fail. Your monitoring platform will often generate error codes that point to specific issues, such as ground faults or DC arc faults. While some errors can be reset remotely, others require a technician visit. Do not attempt to open the inverter yourself; it deals with high voltage and should only be serviced by a qualified installer.
Degradation and End-of-Life Components
All solar panels degrade over time, typically at a rate of 0.5% to 1% per year. Analytics can track this degradation and help you predict when a panel is nearing the end of its useful life. If one panel's output drops significantly faster than others, it may need replacement. Monitoring also helps you catch loose connections or corroded wiring that can cause performance loss and pose a fire risk.
By using analytics to pinpoint the exact cause of underperformance, you avoid wasting money on unnecessary repairs. For example, a homeowner might assume a drop in output means dirty panels, but analytics could reveal a failing microinverter instead. The difference in repair cost is substantial, and accurate diagnosis saves both time and money.
If you are unsure about the diagnosis, many solar installers offer analytics review as part of their maintenance packages. They can access your system data remotely, run diagnostic tests, and recommend the right course of action. This is especially valuable for older systems or those with complex configurations.
Advanced Analytics: AI and Predictive Maintenance
The next frontier in solar performance analytics is artificial intelligence. AI-powered platforms do more than just report data; they learn your system's behavior over time and predict failures before they happen. These tools analyze thousands of data points, from weather patterns to inverter temperature, to identify subtle anomalies that a human might miss.
For example, an AI system might notice that your inverter's temperature is running 3 degrees higher than normal for the current ambient conditions. That could be an early sign of a cooling fan failure, which, if left unchecked, would lead to a complete shutdown during a heatwave. By alerting you weeks in advance, AI gives you time to schedule a repair at a convenient time, avoiding both downtime and emergency service fees.
Predictive maintenance is particularly valuable for commercial solar installations, where every hour of downtime directly impacts the bottom line. However, residential homeowners can also benefit from AI-driven analytics, especially if they have a large system or live in an area with extreme weather. Many modern monitoring apps already incorporate basic machine learning to improve their forecasts and alerts.
Integrating AI into your solar monitoring is often as simple as upgrading your software or subscribing to a premium analytics service. The cost is typically a few dollars per month, but it can save you hundreds by preventing major failures. As the technology matures, AI will become standard in all monitoring platforms, making it easier than ever to keep your solar investment performing optimally.
Turning Solar Data into Real Savings
Solar performance analytics is not just about avoiding problems; it is about maximizing the return on your investment. When you use data to fine-tune your system, you can see tangible financial benefits in several ways.
First, consistent monitoring ensures you are always producing the maximum energy your panels can generate. This directly lowers your electricity bill, and in states with net metering, it can earn you credits from your utility. Over a year, even a 5% improvement in performance can translate to $100 or more in savings for an average home.
Second, analytics help you understand your energy consumption patterns. By correlating your production data with your usage, you can shift high-energy activities like laundry or EV charging to peak solar hours. This reduces your reliance on grid power, especially during peak rate periods, saving you money and reducing stress on the grid.
Third, detailed performance data is a powerful tool when claiming warranties or insurance. If your inverter fails or your panels underperform, having documented evidence of the issue strengthens your claim. Many manufacturers require proof of maintenance and performance history before honoring a warranty, and your analytics dashboard provides exactly that.
Finally, if you ever decide to sell your home, a well-documented solar system with a clean performance record can be a major selling point. Buyers are more confident in a system that has a verified history of high performance, and they may be willing to pay a premium for that peace of mind.
To make the most of your data, review your analytics monthly and set a baseline for your system's expected performance. Use that baseline to identify unusual dips and to measure the impact of any changes you make, such as cleaning panels or upgrading components. With a little attention, your solar system can become one of your best-performing assets.
Ready to take control of your solar investment? Start by exploring our guide on what solar performance tracking is and how it boosts your savings. For a deeper dive into how artificial intelligence is transforming solar monitoring, read our article on AI solar performance tracking for home energy savings. You can also learn more about the broader practice of solar system performance analytics and how it helps you boost energy savings.
Solar performance analytics puts the power of data in your hands. By understanding your system's health and acting on the insights, you can avoid costly surprises, extend the life of your equipment, and enjoy the full financial benefits of your solar array. Start monitoring today, and let the numbers guide you to a more efficient, more profitable solar experience.
Learn more about Solar Panel Installation and Repair for guides, costs, and what to expect.
Compare Solar Panel Installation and Repair Pros Near You
Enter your ZIP code to compare top-rated local professionals and request free quotes.