Solar Site Selection: Sun Exposure And Shading Analysis
Master site selection for solar panels with sun exposure and shading analysis to maximize output. Call 8334344023 for expert help.

By Ryan Brooks
Learn more about Solar Panel Installation and Repair for guides, costs, and what to expect.
Compare Solar Panel Installation and Repair Pros Near You

Enter your ZIP code to compare top-rated local professionals and request free quotes.
A solar array is only as productive as the site beneath it. Two homes on the same street can see wildly different electric bill reductions, and the difference usually comes down to sun exposure, shade patterns, and how carefully the installer evaluated the roof or ground before a single panel was mounted. Site selection for solar panels sun exposure and shading analysis is not a formality; it is the step that determines whether a system delivers 100 percent of its projected output or limps along at 60 percent because a chimney casts a shadow across the array every afternoon.
The stakes are real. A poorly sited array can cost thousands of dollars in lost production over its 25 year life, and no amount of premium equipment will compensate for a roof that spends half the day in the shade of a mature oak. This guide walks through the factors that matter, the tools professionals use, and the practical decisions that separate a high performing installation from a disappointing one.
Why Site Selection Drives Solar Performance More Than Panel Quality
Solar panels are remarkably consistent in quality these days. Even mid tier modules convert 19 to 22 percent of incoming sunlight into electricity, and the gap between a value panel and a premium one is often less than 2 percentage points of efficiency. Shading, by contrast, can reduce output by 20, 50, or even 90 percent depending on the pattern and the inverter technology used. That asymmetry is why experienced installers spend more time on site assessment than on brand selection.
The physics is straightforward. Solar cells are wired in series within a module, and modules are wired in series within a string. When one cell is shaded, it restricts the current flowing through the entire string, similar to a kink in a garden hose. Modern optimizers and microinverters mitigate this by isolating each panel, but they cannot create sunlight where none exists. If a site receives only four hours of direct sun per day instead of six, the array will produce roughly a third less energy regardless of hardware.
This is also why a professional site assessment is worth far more than a quick satellite image review. Tools like solar output prediction help model expected production under real world conditions, but the model is only as good as the shade data fed into it. Garbage in, garbage out applies here as much as anywhere in engineering.
The Core Factors In Sun Exposure Analysis
Sun exposure analysis answers a deceptively simple question: how much direct sunlight will this specific location receive across a full year? The answer depends on latitude, orientation, tilt, and obstructions, and each factor interacts with the others.
Latitude sets the baseline. A home in Phoenix, Arizona receives far more annual solar irradiance than one in Seattle, Washington, and the sun's path across the sky differs significantly. In the northern hemisphere, the sun rises in the east, arcs through the southern sky, and sets in the west. That arc is high in summer and low in winter, which means a roof that performs beautifully in July may underperform in January when the sun sits closer to the horizon and shadows stretch longer.
Orientation and tilt determine how much of that available sunlight actually strikes the panels at a productive angle. In the United States, a south facing roof with a tilt roughly equal to the local latitude is generally optimal. East and west facing roofs can still work well, particularly with time of use electricity rates that reward morning or late afternoon production, but they typically yield 10 to 20 percent less than a comparable south facing array. North facing roofs in most US climates are poor candidates unless the tilt is very shallow or the location is far enough south that the sun passes nearly overhead.
The practical assessment steps professionals follow include:
- Measure the roof pitch and azimuth (compass direction) for each candidate plane.
- Log the latitude and calculate the sun's path for solstices and equinoxes.
- Identify all obstructions: trees, chimneys, vents, satellite dishes, adjacent buildings, and future growth.
- Model hourly shading across a full year using tools such as Solmetric SunEye, Aurora, or PVsyst.
- Compare the resulting shade free hours against the production target for the homeowner's energy goals.
Once those five steps are complete, the installer can calculate a solar access percentage, sometimes called a shade factor, for each roof plane. A plane with 90 percent solar access is excellent. Anything below 70 percent usually warrants a conversation about trimming trees, moving the array to a different plane, or considering ground mount options.
Shading Analysis: Types, Tools, And Tolerances
Shading comes in several forms, and each behaves differently. Hard shading occurs when an opaque object, such as a chimney or a building, completely blocks the sun. Soft shading occurs when light is partially diffused by tree branches, leaves, or haze. Hard shading is more damaging because it eliminates direct beam radiation entirely, while soft shading reduces intensity but still allows diffuse light to reach the cells.
Seasonal shading is the trickiest category. A deciduous tree may be harmless in winter when its branches are bare but cast a dense shadow in summer when it is fully leafed out. Conversely, a low winter sun may be blocked by a neighbor's two story home that poses no problem in June. A proper analysis models shading hour by hour across all twelve months, not just on the day of the site visit.
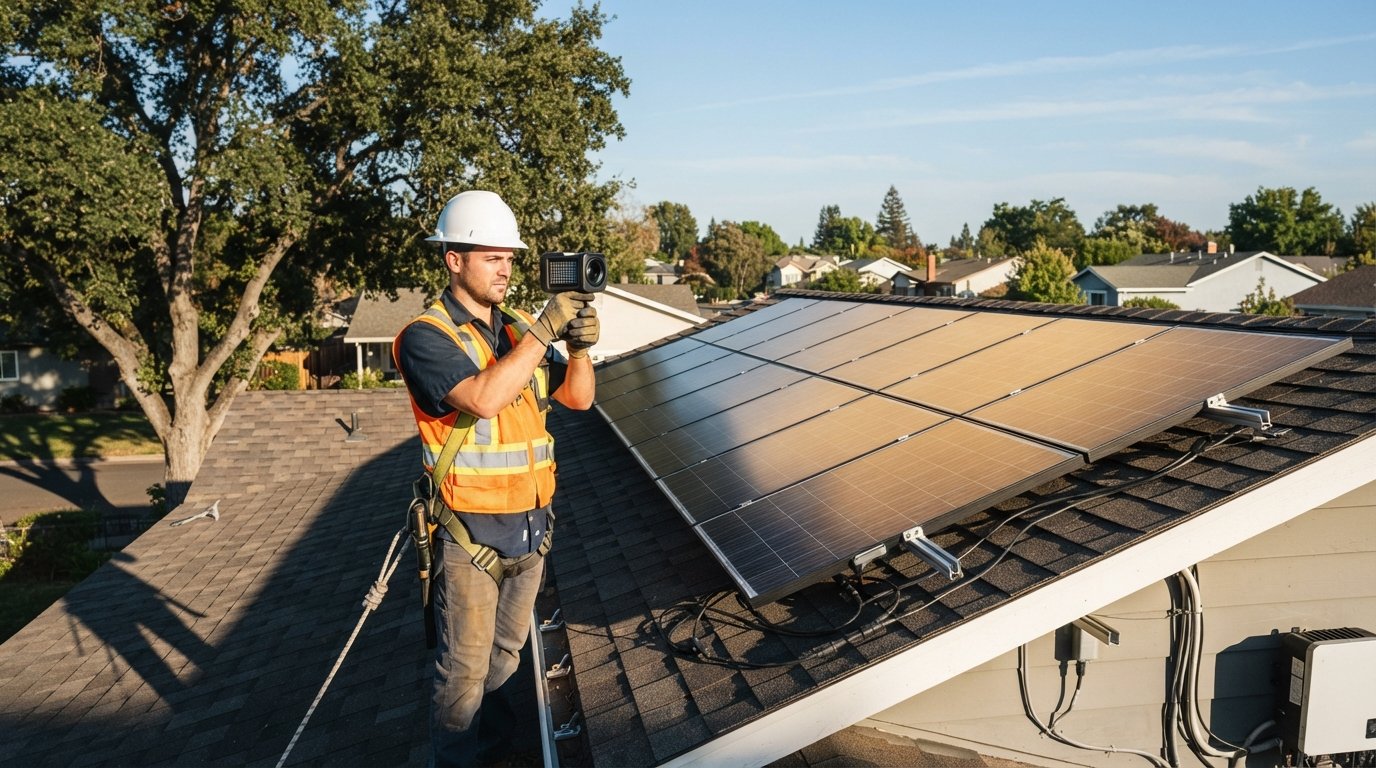
Modern tools have made this far more accurate than the clipboard and compass approaches of two decades ago. A handheld sun path device captures fisheye images of the sky and overlays the sun's trajectory, producing a shade report in minutes. Drone imagery combined with software modeling can map shading across an entire roof with centimeter level precision. For larger commercial projects, LiDAR scans and 3D rendering are standard practice.
Tolerance thresholds matter too. Most residential systems tolerate minor morning or late afternoon shading with minimal production loss because those hours contribute relatively little to total daily output. Shading during the 10 AM to 2 PM window, when the sun is highest and irradiance is strongest, is far more costly. Installers often prioritize array placement to protect the midday window even if it means accepting some edge shading at dawn and dusk.
Roof Versus Ground Mount: Site Selection Tradeoffs
Roof mounts are the default for most residential installations because they use existing structure and require no additional land. But the roof is not always the best site. A ground mount can be oriented and tilted optimally regardless of the home's architecture, and it is far easier to keep clear of shade. The tradeoff is cost (ground mounts typically run 10 to 30 percent more due to trenching, racking, and permitting) and space requirements.
Roof condition is another factor. A roof with fewer than 10 years of remaining life should generally be replaced before solar is installed, because removing and reinstalling panels for a reroof adds significant expense. Roof material matters as well: asphalt shingles, standing seam metal, and tile each require different mounting hardware and have different warranty implications.
For homeowners weighing these options, a professional energy survey is the fastest way to get clarity. SolarEnergy.ai connects homeowners with vetted solar pros who perform on site assessments, including shading analysis and structural review, and provide quotes that reflect the actual site conditions rather than generic estimates. You can also explore independent educational resources such as NewSolarQuotes to compare installation cost calculators and savings analyses before committing to a contractor.
Ground mounts make particular sense when the roof is heavily shaded but the yard is open, when the homeowner wants easy access for cleaning and snow removal, or when the system needs to be oversized relative to roof area. They also pair well with tracking systems that follow the sun across the sky, boosting production by 15 to 25 percent compared with fixed mounts in high irradiance locations.
Evaluating Trees, Obstructions, And Future Growth
Trees are the most common and most underestimated shading problem. A tree that looks harmless during a winter site visit may cast a shadow extending 30 feet or more across the roof in summer. The rule of thumb is that a tree's shadow at solar noon is roughly 1.5 to 2 times its height in winter and closer to 1 times its height in summer, depending on latitude.
Homeowners have three realistic options when trees shade a candidate array location:
- Trim or remove the offending trees, which may require a permit in some municipalities.
- Relocate the array to a less shaded roof plane or a ground mount position.
- Accept the shading and size the system larger to compensate, though this reduces return on investment.
Future growth is the wild card. A sapling today may be a 40 foot shade producer in 15 years, right in the middle of the system's productive life. Good site selection accounts for that trajectory, not just the current canopy. Installers who ask about planned landscaping, neighboring construction, and local tree ordinances are doing their job properly.
Other obstructions deserve equal attention. Chimneys cast hard shadows that are especially damaging because they fall on the same cells day after day, creating hot spots that degrade performance over time. Vent pipes, attic fans, and skylights create smaller but still meaningful shade. Even power lines and utility poles can intrude on the sun's path at certain times of year.
Using Data And Monitoring To Validate Your Site Choice
Once a system is installed, monitoring data provides the ultimate validation of the site selection decision. Production that consistently falls 15 percent or more below the modeled estimate usually points to a shading issue that was missed, a soiling problem, or an equipment fault. Comparing actual output to expected output month by month helps catch these issues early, when they are still cheap to fix.
Smart monitoring platforms now integrate weather data, irradiance sensors, and inverter telemetry to isolate the cause of underperformance. If production drops only on clear afternoons, shading is the likely culprit. If it drops uniformly across all conditions, soiling or a failing component is more probable. This kind of diagnostic clarity is one reason modern solar systems deliver better long term returns than older installations that lacked granular data.
For homeowners still in the planning stage, the takeaway is simple: insist on a real shading analysis, not a guess. Ask the installer to show the shade report, explain the solar access percentage for each roof plane, and document any assumptions about tree growth or future obstructions. A contractor who cannot produce that documentation is not doing the analysis that site selection for solar panels sun exposure and shading analysis demands. If you want a second opinion or need to find a qualified installer in your area, SolarEnergy.ai can connect you with local professionals who handle the full assessment process, and their solar savings calculator can help you translate production estimates into dollar figures before you sign anything.
Site selection is where solar projects succeed or fail, long before the first panel is lifted onto the roof. Get the sun exposure and shading analysis right, and every other decision becomes easier. Get it wrong, and no upgrade, warranty, or monitoring app will fully recover the lost production.