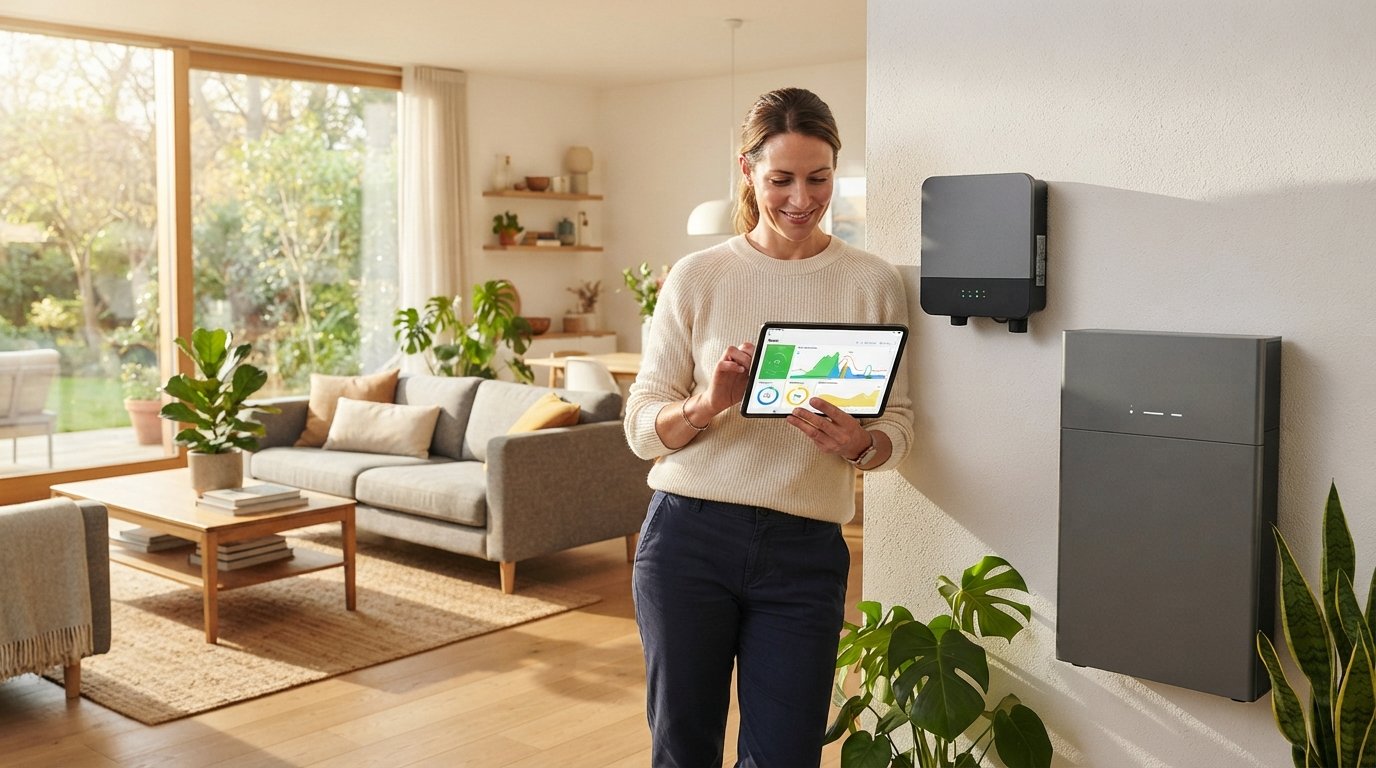
Smart Home Energy Dashboard for Solar Production and Consumption
A smart home energy dashboard for solar production and consumption shows exactly where every kilowatt goes, helping you cut bills and boost savings.

By Mason Carter
Learn more about Solar Panel Installation and Repair for guides, costs, and what to expect.
Compare Solar Panel Installation and Repair Pros Near You

Enter your ZIP code to compare top-rated local professionals and request free quotes.
Your solar panels are generating power right now. Do you know how much? More importantly, do you know where every kilowatt-hour is going? Most homeowners with solar systems can check a basic app that shows total production, but that number alone does not tell you whether you are actually saving money. A smart home energy dashboard for solar production and consumption changes that by showing you the full picture: what your panels make, what your home uses, and how those two numbers interact in real time. Without this visibility, you are essentially driving without a fuel gauge. You might be producing plenty of energy, but if it is flowing to the grid when rates are low and you are pulling from the grid when rates are high, your savings disappear. This guide explains how these dashboards work, what features matter most, and how to choose the right one for your home.
What a Smart Home Energy Dashboard Actually Does
A smart home energy dashboard is a software platform, often paired with hardware sensors, that collects data from your solar inverter, battery system, smart meter, and individual appliances. It then displays that information in a unified interface, usually accessible on your phone, tablet, or computer. The goal is simple: give you one place to see everything happening with your home energy.
The most basic dashboards show only solar production. You see a line graph of how much electricity your panels generated today, this week, or this month. That is useful for confirming your system is working, but it does not help you optimize. A truly smart dashboard goes further by integrating consumption data. It shows how much energy your home is using at any given moment, broken down by source: solar, battery, or grid.
When production and consumption are displayed together, patterns emerge. You might notice that your air conditioner kicks on at 4 PM, right when solar production starts declining. Or you might see that your EV charger runs overnight, pulling expensive grid power instead of using stored solar. These insights are the foundation of real energy savings.
Advanced dashboards also incorporate rate structures. If your utility uses time-of-use pricing, the dashboard can show you exactly how much each kilowatt-hour costs at different times of day. Some platforms even calculate your savings in real time, showing you a dollar amount that accumulates as your panels offset grid usage. This immediate feedback loop is powerful: it turns abstract energy data into concrete financial information.
For homeowners who want to go deeper, AI-driven energy efficiency tools can analyze historical data and predict future patterns. These systems learn your habits and suggest specific actions, such as running the dishwasher at noon instead of 7 PM, to maximize solar self-consumption.
Key Features to Look For in a Solar Dashboard
Not all dashboards are created equal. Some are basic monitoring tools that come free with your inverter. Others are comprehensive energy management platforms that can control devices, optimize battery charging, and integrate with smart home systems. The right choice depends on your goals and your existing equipment.
When evaluating options, consider what data you need and how you want to act on it. A dashboard that only shows past performance is useful for tracking, but a dashboard that provides real-time recommendations is useful for saving money. Here are the features that matter most:
- Real-time production and consumption monitoring: See current solar output and home usage side by side, updated every few seconds.
- Historical data and trends: Review daily, weekly, and monthly patterns to identify inefficiencies and track improvement over time.
- Battery state of charge and flow: If you have storage, know exactly how full your battery is and whether it is charging or discharging.
- Grid import and export tracking: Understand when you are buying power versus selling it back, especially important with net metering changes.
- Appliance-level breakdown: Some systems use circuit-level sensors to show which devices consume the most energy.
- Cost and savings calculations: Translate kilowatt-hours into dollars based on your specific utility rates.
- Smart home integration: Connect with platforms like Google Home, Amazon Alexa, or Apple HomeKit for voice control and automation.
The presence of these features varies widely. Entry-level dashboards from inverter manufacturers often include only the first two or three. Third-party platforms like Sense, Emporia, or SolarEdge's monitoring suite offer more comprehensive capabilities. Some utilities also provide their own dashboards, though these tend to focus on grid usage rather than solar production.
It is also worth considering whether the dashboard supports control functions. Monitoring is passive; you watch data. Control is active; the system adjusts settings based on your preferences. For example, a smart dashboard might automatically charge your battery when solar production is high and discharge it during peak rate periods. This level of automation can significantly increase savings without requiring you to constantly check the app.
How Dashboards Maximize Solar Savings
The financial case for a smart dashboard is straightforward: the more you know about your energy flows, the more you can optimize them. But the specifics matter. Let us walk through the main ways a dashboard translates data into dollars.
First, dashboards help you increase self-consumption. When your solar panels produce electricity, you have two options: use it immediately or send it to the grid. With many utilities reducing net metering rates, using your own solar power is often more valuable than exporting it. A dashboard shows you when production peaks and when your home is using the most energy. By shifting flexible loads, such as laundry, dishwashing, or EV charging, to those peak production hours, you reduce grid reliance and keep more of your solar energy for yourself.
Second, dashboards help you avoid peak demand charges. Some utilities charge higher rates during specific hours, typically late afternoon and early evening. If your dashboard shows that you are pulling grid power during those times, you can take action. Charge your battery earlier in the day, pre-cool your home before peak rates kick in, or delay high-energy tasks until rates drop. Each of these adjustments chips away at your bill.
Third, dashboards can detect problems early. If a panel goes offline or an inverter fails, production drops. Without monitoring, you might not notice for weeks, losing both energy and savings. A dashboard with alerting features notifies you immediately, allowing you to schedule repairs before the issue compounds.
Fourth, dashboards provide the data you need to make informed decisions about system upgrades. Perhaps you are considering adding a battery. Your dashboard shows how much excess solar you export and when. If you are exporting a lot during peak rate periods, a battery could store that energy and use it later, increasing your savings. Without historical data, you are guessing. With it, you can model the ROI of an upgrade with confidence.
For homeowners who want professional guidance on optimizing their system, connecting with trusted solar energy resources can provide additional insights and installation support. These services can help you interpret dashboard data and recommend hardware or settings changes that align with your goals.
Choosing the Right Dashboard for Your Home
Selecting a dashboard is not a one-size-fits-all decision. Your existing equipment, budget, and technical comfort level all play a role. Start by identifying what you already have. If your solar inverter came with a monitoring app, that is your baseline. Determine whether it provides the data you need or whether you require more granularity.
Next, consider compatibility. Some dashboards work only with specific inverter brands. Others are brand-agnostic and use CT (current transformer) sensors to monitor circuits independently. If you have a mixed setup (for example, SolarEdge inverter with a Tesla Powerwall), you may need a third-party solution that can aggregate data from multiple sources.
Budget is another factor. Basic monitoring is often included with your system at no extra cost. Mid-range options like Emporia Vue or Sense cost a few hundred dollars and offer appliance-level detail. Premium platforms with advanced automation and battery control may cost more but can deliver higher savings if you have complex rate structures or significant energy use.
Finally, think about your long-term goals. If you plan to add an EV, a heat pump, or additional solar capacity, choose a dashboard that can scale with your system. Look for open APIs or integrations with smart home platforms, which future-proof your investment.
Installation and Setup Basics
Most smart home energy dashboards require some hardware installation. This typically involves placing current transformers (CTs) around the main service wires in your electrical panel. These sensors measure the flow of electricity and transmit data to a central hub, which then sends it to the cloud for processing and display.
If you are comfortable working inside an electrical panel, you can install some systems yourself. However, safety is paramount. If you are not experienced with electrical work, hire a licensed electrician. The cost is usually modest, and the peace of mind is worth it.
Once installed, setup involves connecting the hub to your Wi-Fi network and creating an account on the dashboard platform. You will need to input your utility rate structure, including time-of-use periods and net metering details. The more accurate this information, the more precise your savings calculations will be.
After initial setup, take time to explore the dashboard. Watch how data updates throughout the day. Identify your home's baseload (the energy used when nothing is actively running) and look for anomalies. Many platforms offer tutorials or support to help you get the most from your data.
Integrating with Smart Home Ecosystems
The value of a dashboard increases when it connects with other smart home devices. Imagine your dashboard detecting that solar production is high and automatically triggering your smart thermostat to cool the house, storing thermal energy for later. Or your EV charger receiving a signal to start charging when excess solar is available.
Integration options vary. Some dashboards have native support for popular platforms like Google Home, Amazon Alexa, and Apple HomeKit. Others rely on IFTTT (If This Then That) or open APIs to create custom automations. If you already have a smart home hub, check compatibility before purchasing a dashboard.
Even without full automation, integration provides convenience. You can ask your voice assistant for a solar production update or receive notifications when battery levels drop below a certain threshold. These small touches make energy management a seamless part of daily life.
Common Mistakes to Avoid
Many homeowners install a dashboard and then ignore it. The data sits there, unused, and savings remain unrealized. To avoid this, set a routine. Check your dashboard at least once a week, perhaps on Sunday evening, to review the past week's performance. Look for trends and adjust accordingly.
Another mistake is assuming that all exported energy is credited at full retail rate. With net metering policies changing across the country, many utilities now credit exports at wholesale rates or lower. If your dashboard shows significant exports during off-peak hours, you might be better off storing that energy in a battery and using it later. The dashboard data makes this trade-off visible.
Finally, do not overlook the importance of accurate rate configuration. If your dashboard does not know your actual utility rates, its savings calculations will be wrong. Take the time to input the correct information, and update it whenever your utility changes its rate structure.
By avoiding these pitfalls, you turn your dashboard from a passive display into an active tool for reducing energy costs. The combination of real-time data, historical trends, and actionable insights is what makes a smart home energy dashboard for solar production and consumption such a powerful addition to any solar home.
Your solar investment deserves more than guesswork. With the right dashboard, you gain the clarity to make every ray of sunshine count, maximizing both your energy independence and your financial return.