Solar System Performance After Ten Years: Real World Data
Real world data shows solar systems retain 90 to 96 percent output after ten years. Call (833)-434-4023 to plan maintenance and protect savings.

By Victor Walsh
Learn more about Solar Panel Installation and Repair for guides, costs, and what to expect.
Compare Solar Panel Installation and Repair Pros Near You

Enter your ZIP code to compare top-rated local professionals and request free quotes.
When you buy a solar energy system, the sales brochure promises clean power for decades. But what actually happens to output after a decade of sun, rain, dirt, and seasonal swings? Real world data from thousands of installations tells a more nuanced story than lab tests or warranty curves. Understanding solar system performance after ten years real world data helps you separate optimistic marketing from field-proven results, so you can plan maintenance, budget for replacements, and set realistic savings expectations. This article digs into measured degradation rates, inverter lifespans, soiling losses, and the maintenance steps that keep a decade-old array producing close to its original rating.
How Much Do Solar Panels Really Degrade in Ten Years?
Manufacturers typically warrant that panels will produce at least 80 to 90 percent of their original rated power after 25 years. That implies an annual degradation rate of roughly 0.5 to 0.8 percent per year. In real world conditions, most well-installed systems degrade at or below that rate, but the spread is wide. Field studies from independent monitoring platforms and research labs show median annual degradation around 0.5 percent for monocrystalline silicon modules, with some systems losing less than 0.3 percent per year and others losing more than 1 percent.
After ten years, a system that started at 100 percent of rated output might realistically sit between 90 and 96 percent, depending on climate, mounting, and module quality. The compounding effect matters: a 1 percent annual loss leaves you at about 90.4 percent after a decade, while a 0.5 percent loss leaves you at roughly 95.1 percent. That difference translates directly into lost kilowatt-hours and reduced bill savings. If you want to model your own numbers, tools like solar system performance analytics can help you compare expected versus actual production year over year.
It is important to distinguish nameplate degradation from system-level performance. Even if panels degrade slowly, other components and environmental factors can drag down total output. Inverter efficiency, wiring losses, soiling, and shading all interact. A system that looks fine on a panel-level warranty claim may still underperform because of these balance-of-system issues. Real world data after ten years usually reveals that panels are not the weakest link; the surrounding hardware and site conditions often matter more.
Field Data Versus Warranty Curves: What the Numbers Show
Warranty curves are linear or stepped guarantees, not predictions. They are designed to protect the manufacturer's liability, not to describe typical performance. Field data from fleet monitoring tells a different story. For many Tier 1 brands, actual degradation after ten years clusters between 4 and 7 percent total loss, which is better than the warranty floor of 10 to 20 percent. However, some installations show higher losses due to hot climates, poor ventilation, or manufacturing defects that only appear after years of operation.
Common panel brands with strong field records tend to show median degradation of 0.4 to 0.6 percent per year in temperate climates. In hotter regions such as the desert Southwest, thermal cycling and high ambient temperatures can push degradation toward 0.7 to 0.9 percent per year. Coastal areas with salt mist and humidity may see additional encapsulant degradation or connector corrosion if mounting and sealing are not robust. The key takeaway is that climate and installation quality create more variation than brand name alone.
When reviewing solar system performance after ten years real world data, look for studies that separate panel degradation from system degradation. Many reports mix the two, which inflates apparent panel losses. If you are evaluating a used system or planning a repower, ask for production data normalized to weather and irradiance. Without that normalization, a cloudy year can look like degradation, and a sunny year can mask real losses.
Inverter Replacement Timing Within the First Decade
Inverters are the most common component to fail or underperform within the first ten years. String inverters often carry 10-year warranties, and many units begin to show reduced efficiency or intermittent faults around year 8 to 12. Microinverters and power optimizers typically have 25-year warranties, but their electronics still experience heat stress. Real world data shows that a meaningful share of central inverters are replaced or repaired before year 10, especially in hot attics or garages without active cooling.
When an inverter fails, the entire array can stop producing, which makes replacement timing a critical financial event. Some homeowners choose to replace a failing inverter with a newer, more efficient model that includes monitoring and grid-support features. Others take the opportunity to add battery storage or transition to module-level electronics. Budgeting for one inverter replacement around year 10 to 12 is prudent, even if the warranty covers the hardware, because labor and shipping may not be fully covered.
Real world data also shows that inverter efficiency degrades slightly over time, typically by less than 1 percent, but heat and dust can accelerate fan wear and thermal derating. If your system seems to clip more often or produce lower peak output than it did in year one, the inverter may be the culprit. Monitoring at the inverter level helps distinguish panel losses from electronics issues, which is why performance analytics are so valuable for long-term owners.
Soiling, Shading Growth, and Tree Maturation
Soiling losses are often underestimated. In dry, dusty regions, accumulated dirt can reduce output by 5 to 15 percent between cleanings. After ten years, the cumulative effect of infrequent cleaning can make a system look like it has degraded faster than it actually has. Rain provides some natural cleaning, but pollen, bird droppings, and agricultural dust require manual intervention. Real world data from maintenance logs shows that systems cleaned at least once every 12 to 24 months maintain higher average output than neglected systems.
Shading is another slow-moving threat. Trees planted near an array can grow several feet in a decade, turning a shade-free roof into a partially shaded one. New construction, chimneys, and even satellite dishes can introduce shading that did not exist at installation. Because shading losses are nonlinear and can affect entire strings, a small new shadow can cause a disproportionate drop in production. After ten years, it is worth reassessing the site for new obstructions and considering module-level power electronics or tree trimming.
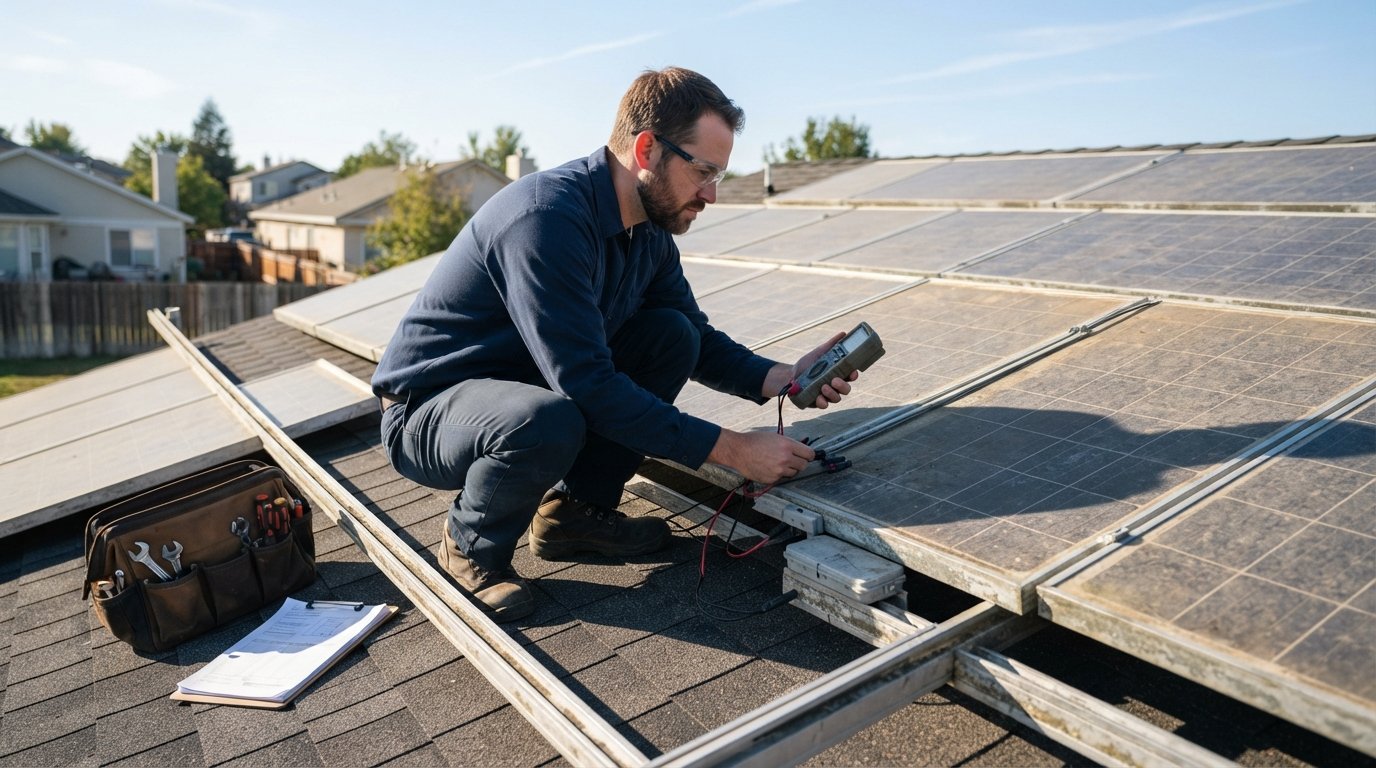
Snow and ice accumulation in cold climates can also stress mounting hardware and cause microcracks if panels are not installed with proper clearance. While snow typically slides off tilted panels, repeated freeze-thaw cycles can loosen clamps and rails. Real world inspections after a decade often find loose hardware, degraded flashing, and rodent damage to wiring, all of which affect safety and performance. These issues are rarely covered by panel warranties, so they fall to the homeowner to monitor.
Maintenance and Inspection Steps That Preserve Output Into Year Ten
Preserving output after ten years is less about exotic technology and more about disciplined maintenance. A simple annual routine can catch problems before they become expensive. Start with visual inspections from the ground, then schedule professional checks every few years. The following steps form a practical framework for keeping a decade-old system near its expected performance.
- Clean panels safely: Remove debris and dirt with soft brushes and plain water, avoiding abrasive tools and harsh chemicals. In dusty areas, clean every 12 months; in temperate areas, every 24 months may suffice.
- Check for shading changes: Walk the property and note new tree growth, construction, or objects that cast shadows on the array. Trim trees before they affect production.
- Inspect mounting and wiring: Look for loose clamps, rusted rails, cracked conduit, and rodent damage. Address any water intrusion around roof penetrations immediately.
- Review monitoring data: Compare monthly production to prior years and to weather-normalized expectations. A sudden 5 percent drop warrants investigation.
- Test inverter and safety devices: Confirm that rapid shutdown, grounding, and arc-fault protection are functioning. Replace aging inverters proactively if monitoring shows instability.
Beyond these steps, keep a maintenance log with dates, observations, and any repairs. This record is valuable if you sell the home, file a warranty claim, or need to demonstrate system performance to a buyer. It also helps you spot trends, such as gradual soiling losses or seasonal shading patterns, that are invisible in day-to-day observation.
For homeowners planning a move, documenting solar performance can also support the sale. Resources like Moving.Homes offer checklists for transferring utility accounts and explaining system details to buyers, which can reduce friction during a home sale. A well-documented array with ten years of production data is a stronger selling point than an undocumented one, even if both are technically identical.
What Ten-Year Real World Data Means for Your Savings
By year ten, a typical residential system may be producing 92 to 95 percent of its original output, assuming moderate soiling and no major shading changes. That means your bill savings in year ten will be slightly lower than in year one, but still substantial. If you financed the system, the loan payment may now represent a larger share of the value produced, but the overall economics usually remain favorable. Systems with battery storage may see different performance because battery capacity also degrades, typically to 70 to 80 percent of original capacity after a decade.
Real world data also highlights the importance of monitoring and analytics. Without data, owners often assume performance is fine until a bill spikes or an inverter fails. With analytics, you can detect soiling, shading, and equipment issues early, often within a billing cycle. That early detection is worth more than any single maintenance task because it prevents silent losses from compounding over months.
When you evaluate solar system performance after ten years real world data, focus on trends rather than absolutes. A system that produced 5 percent less in year ten than year one may still be performing within warranty and within expectations. The goal is not to match the lab curve but to avoid avoidable losses from dirt, shade, and failed electronics. Regular cleaning, shading management, and inverter monitoring are the highest-leverage actions.
Planning for the Next Decade
After ten years, many systems are candidates for targeted upgrades rather than full replacement. Adding module-level monitoring, replacing an aging inverter, or installing a battery can extend useful life and improve resilience. If your roof is nearing replacement age, plan the solar removal and reinstallation carefully to avoid damaging modules and racking. Real world data shows that systems reinstalled with new flashing and mounting hardware often perform better than the original installation because corrosion and sealant issues are addressed.
It also helps to reassess incentives and rate structures. Net metering rules and time-of-use rates may have changed since your system was installed, which affects the value of each kilowatt-hour produced. Shifting loads to midday or adding storage can improve self-consumption and savings even if total production is slightly lower. A performance review every few years keeps your system aligned with current utility programs and technology.
Finally, remember that ten years is only the midpoint for most modern modules. With modest maintenance and timely inverter replacement, many systems continue producing well beyond 25 years. The real world data is encouraging: degradation is real but manageable, and the biggest risks are often avoidable. By tracking performance and addressing soiling, shading, and hardware issues early, you can protect your investment and keep your solar system delivering value for decades.