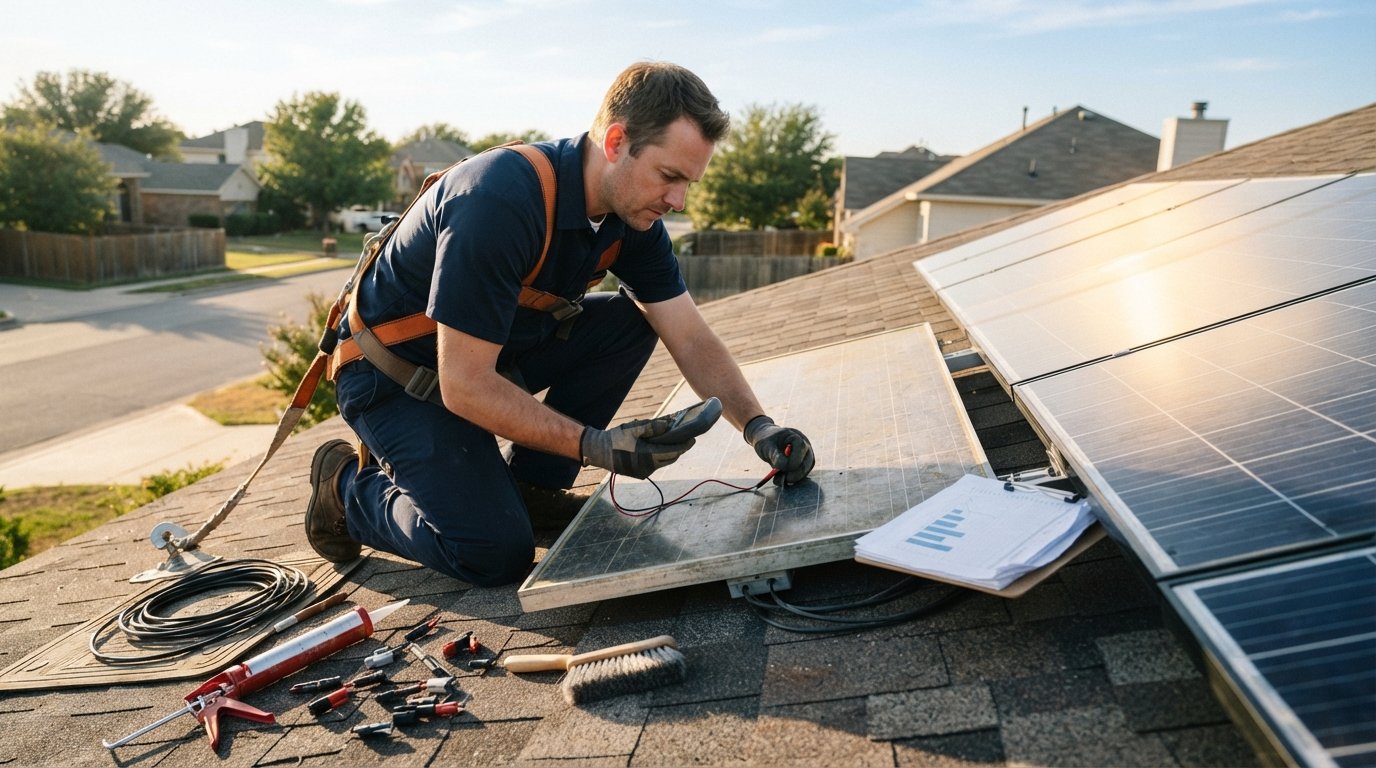
Solar Panel Efficiency Over Time: Performance Guide
Solar panel efficiency over time performance drops about 0.5 percent yearly, so smart monitoring and maintenance protect your savings for 25 years.

By Dylan Harris
Learn more about Solar Panel Cleaning for guides, costs, and what to expect.
Compare Solar Panel Cleaning Pros Near You

Enter your ZIP code to compare top-rated local professionals and request free quotes.
Solar panels are one of the most durable energy investments a homeowner can make, but they are not immortal. Understanding how solar panel efficiency over time performance unfolds is essential for setting realistic expectations, planning maintenance, and protecting the return on your investment. Most modern panels lose only a fraction of a percent of output each year, yet real world conditions such as heat, dust, snow, and aging wiring can accelerate that decline. This guide breaks down the science behind degradation, the industry warranties that protect you, and the practical steps that keep your system producing at its best for decades.
What Solar Panel Efficiency Over Time Performance Actually Means
When people talk about solar panel efficiency, they usually mean the percentage of sunlight a panel converts into electricity under standard test conditions. A premium residential panel might be rated at 21 percent efficiency, while an older or budget model might sit closer to 15 percent. That number is a snapshot. Solar panel efficiency over time performance is the moving picture: how that conversion rate changes as the panel ages, heats up, gets dirty, or experiences voltage shifts in its internal circuitry.
Two forces drive most of the change. The first is degradation, a permanent, gradual loss of power output that happens at the semiconductor level. The second is soiling and environmental interference, which is temporary but can be severe. A panel that loses 0.5 percent per year to degradation is very different from one that loses the same amount because pollen and dust are blocking the glass. Distinguishing between the two matters, because one requires a warranty claim or replacement, while the other simply requires a cleaning.
Manufacturers quantify degradation using a percentage of the original rated output. If a 400 watt panel drops to 380 watts after a decade, it has degraded by 5 percent. That figure is what appears on datasheets and warranty documents, and it is the single most useful number for comparing long term performance across brands. For a deeper look at how one well known brand handles this, see our guide on Qcells solar panel efficiency and durability.
Typical Degradation Rates by Panel Technology
The chemistry inside a panel determines how gracefully it ages. Monocrystalline silicon, the dominant technology in residential solar, generally holds up best. Polycrystalline panels, once common and now less so, tend to degrade slightly faster. Thin film panels, including cadmium telluride and amorphous silicon, have their own curve, often with a steeper initial drop followed by a long, slow tail.
Here is a practical comparison of first year and annual degradation rates you can expect from each major technology:
- Monocrystalline silicon: about 2 percent in year one, then 0.25 to 0.5 percent per year thereafter.
- Polycrystalline silicon: about 2 to 3 percent in year one, then 0.5 to 0.7 percent per year.
- Thin film (CdTe): about 3 to 5 percent in year one, then 0.4 to 0.6 percent per year.
- Bifacial monocrystalline: similar to standard mono, with additional rear side gains that can offset visible degradation.
That first year drop is not a defect. It is a known stabilization period during which the silicon lattice and dopants settle into a steady state. After year one, the curve flattens. A good monocrystalline panel rated for 0.25 percent annual degradation will still produce roughly 92 percent of its original output at year 25, which is why most tier one warranties guarantee at least 80 to 85 percent at that milestone.
It is worth noting that degradation is not perfectly linear. Some panels lose a little more in hot climates, and some lose a little more in regions with extreme temperature swings. The published rate is an average, and your actual results will depend on installation quality, mounting clearance, and local weather.
How Heat, Soiling, and Shading Affect Real World Output
Temperature is the silent performance killer. Solar panels are tested at 25 degrees Celsius (77 degrees Fahrenheit) cell temperature. On a sunny roof in Arizona or Florida, cell temperatures can exceed 65 degrees Celsius (149 degrees Fahrenheit). For every degree above 25 C, a typical silicon panel loses about 0.3 to 0.5 percent of its output. That means a brutally hot afternoon can cut production by 15 percent or more, even though the panel itself is perfectly healthy.
Soiling is the other major factor. Dust, pollen, bird droppings, and agricultural spray all block light before it reaches the cells. In most of the United States, rain handles routine cleaning, and the loss stays under 5 percent. In dry, dusty regions or near highways and farms, soiling losses can climb into double digits within weeks. A light cleaning restores that output immediately, which is why soiling is a maintenance issue rather than a degradation issue.
Shading is more insidious. Even partial shade on a single cell can disproportionately reduce the output of an entire string, because panels are wired in series. Over years, a growing tree or a new chimney can quietly erode system performance. If your production data shows a sudden step down rather than a gradual slope, shading or a failed component is the likely culprit, not normal degradation.
Inverters age too. A string inverter typically lasts 10 to 15 years, and microinverters often last 15 to 25 years. When an inverter fails, the panels may be fine, but the system stops producing. Monitoring both panel and inverter health is the only way to separate true degradation from a fixable hardware problem.
Warranties, Monitoring, and What to Expect at Year 25
Solar warranties come in two layers. The product warranty covers defects in materials and workmanship, usually for 10 to 25 years depending on the brand. The performance warranty guarantees a minimum power output, typically 80 to 85 percent of the original rating at year 25, and sometimes 87 percent or higher for premium lines. Together, these warranties define the floor of your solar panel efficiency over time performance.
To know whether your system is meeting that floor, you need data. Most modern systems include monitoring software that reports daily, monthly, and lifetime production. A few habits turn that data into a diagnostic tool:
- Record your first full year of production as a baseline.
- Compare each subsequent year, adjusting for weather and seasonal variation.
- Watch for sudden drops (possible equipment failure) versus slow declines (normal degradation).
- Schedule a professional inspection every three to five years, or sooner if output falls unexpectedly.
If your measured degradation exceeds the warranty rate, you may be entitled to a replacement panel or a partial refund. That claim is far easier to win with years of clean monitoring data in hand. If you are still shopping for a system and want to compare quotes from vetted local installers, a service like NewSolarQuotes can connect you with providers who explain degradation terms clearly before you sign.
At year 25, a well maintained monocrystalline system in a moderate climate will typically produce between 80 and 90 percent of its day one output. That is more than enough to keep delivering meaningful savings, especially if electricity rates have risen in the meantime. Many homeowners find that the system still pays for itself several times over even at reduced output.
Practical Steps to Slow Efficiency Loss
You cannot stop physics, but you can slow the clock. The single biggest lever is installation quality. Panels mounted with adequate air gap underneath run cooler, which reduces thermal degradation. Proper wiring and quality connectors prevent resistance heating that can damage cells over time. Using a reputable installer is therefore not just about safety, it is about long term performance.
Routine maintenance is the second lever. Cleaning panels once or twice a year in dusty climates, trimming vegetation that casts shadows, and keeping the inverter in a shaded, ventilated location all extend the useful life of the system. Thermal imaging inspections can catch hot spots, cracked cells, and failing bypass diodes before they drag down an entire string.
Finally, plan for replacement at the right time. Panels rarely fail outright, but inverters do. Budgeting for an inverter replacement around year 12 to 15 avoids surprise downtime. If you add battery storage or an AI driven energy management system later, you can often squeeze more value out of the same panels by shifting production to hours when electricity is most expensive. That does not change panel efficiency, but it changes the economics of every kilowatt hour you generate.
Solar panel efficiency over time performance is ultimately a story of small numbers compounding in your favor. A quarter percent per year sounds trivial, yet over 25 years it defines whether your system still covers most of your bill or only part of it. Choose quality equipment, install it well, monitor it consistently, and your panels will keep earning for decades.