How to Monitor Solar Panel Degradation Over Time
Track solar panel degradation with baselines, performance ratios, and alerts to protect savings. Call 8334344023 for expert help.

By Ryan Brooks
Learn more about Solar Panel Installation and Repair for guides, costs, and what to expect.
Compare Solar Panel Installation and Repair Pros Near You

Enter your ZIP code to compare top-rated local professionals and request free quotes.
Your solar panels are quietly losing power right now. Every panel on every roof degrades a little each year, and the difference between a system that quietly bleeds value and one that gets caught early often comes down to whether anyone is watching the numbers. A typical panel loses roughly 0.5 percent of its output annually, which sounds trivial until you do the math: a 10 kW array can shed hundreds of dollars in production over a decade if degradation accelerates and nobody notices. Monitoring solar panel degradation over time is not a paranoid habit. It is basic financial hygiene, the same way you would track a retirement account or a rental property.
The good news is that modern monitoring tools make this far easier than it used to be. Inverters log production data, apps surface it on your phone, and AI driven platforms can flag anomalies before you would ever spot them on a utility bill. This guide walks through the full process: understanding normal degradation rates, choosing the right monitoring setup, running a baseline test, reading the data correctly, and knowing when to call a professional. Along the way, you will learn what separates a warranty claim from a shrug, and how to protect the return on investment you calculated when you first went solar.
What Normal Solar Panel Degradation Actually Looks Like
Manufacturers publish a degradation curve for every panel they sell, and it usually follows a predictable shape. The first year is the steepest: most panels lose about 2 to 3 percent of their rated output during the initial months as the cells stabilize. After that, the rate flattens to roughly 0.5 percent per year for monocrystalline and polycrystalline products, and slightly faster for some thin film options. A panel warrantied at 80 percent output after 25 years is telling you exactly what the manufacturer expects: about 20 percent total loss across a quarter century.
Those numbers matter because they give you a benchmark. If your system is producing 15 percent less than it did in year one and it is only year six, something is off. It could be degradation, but it could also be soiling, shade from a new tree, a failing inverter string, or a panel that has developed hot spots. The whole point of monitoring is to separate normal aging from a fixable problem, because the second category is where money gets recovered.
Temperature and weather also distort the picture. Panels produce less on hot days, more on cold clear days, and wildly variable output under passing clouds. A single low reading means nothing. A trend across weeks and seasons means everything. This is why professional monitoring focuses on normalized metrics rather than raw daily totals, and why the first step in any degradation analysis is establishing a clean baseline against which future readings can be compared.
Setting Up a Monitoring System That Actually Works
Most grid tied solar installations already include some form of monitoring through the inverter. String inverters from major brands typically report system level production, while microinverters and DC optimizers report at the panel level. If your system was installed in the last several years, you probably have an app already. The question is whether you are using it as a dashboard or as a diagnostic tool.
For serious degradation tracking, you want three layers of data. First, inverter level production data, which tells you total system output over time. Second, panel level data where available, which isolates problems to specific modules. Third, an independent production meter or utility net metering record, which validates what the inverter claims. When all three agree, your data is trustworthy. When they diverge, you have found either a monitoring fault or a real performance issue worth investigating.
Homeowners who want deeper insight can add standalone monitoring hardware, including current transformers on the main service panel and weather stations that record irradiance and temperature. These additions let you calculate a performance ratio: actual production divided by what the system should have produced given the sunlight it received. That ratio is the single most useful number in degradation analysis, because it strips out weather and isolates the health of the equipment itself.
For a practical setup, most homeowners can follow a simple checklist:
- Confirm your inverter monitoring app is connected and logging data daily, not just when you open it.
- Enable alerts for production drops below a set threshold, typically 10 to 15 percent under expected output.
- Record a baseline production number during the first full spring or summer after installation.
- Add a weather or irradiance reference if you want performance ratio tracking instead of raw kilowatt hours.
- Download monthly data exports so you own the history even if you change monitoring platforms.
That last point is easy to overlook and important. If you switch inverter brands, sell the home, or lose app access, your data history can vanish. A simple spreadsheet with monthly production totals takes five minutes to maintain and becomes the backbone of any future warranty claim. For homeowners who want real time insight without manually checking spreadsheets, AI driven monitoring platforms can automate this entire process, and our guide on how AI monitors solar systems explains how those tools detect degradation patterns automatically.
Running a Baseline Test and Calculating Degradation Rate
The cleanest way to measure degradation is to compare like with like. You cannot compare January production to July production, and you cannot compare a cloudy year to a sunny one. What you can do is compare the same month or season across multiple years, ideally using a performance ratio that accounts for weather.
Start by identifying your reference period. The first full year after installation is ideal, provided the system was commissioned correctly and no shade issues existed at the time. Pull monthly production totals for that year. Then, for each subsequent year, pull the same months and calculate the percentage change. A system losing 2 percent year over year in year five is degrading faster than its warranty curve predicts. A system losing 0.4 percent is right on track.
If you have panel level monitoring, repeat the process per module. This is where the real value shows up. A single underperforming panel dragging down an entire string is one of the most common and most fixable degradation scenarios. It could be a cracked cell, a failed bypass diode, or a connector issue, and catching it early can mean a warranty replacement instead of a slow bleed for years.
For homeowners who prefer a structured approach, a simple degradation log works well. Record the following each month:
- Total production in kilowatt hours from the inverter app.
- Utility net metering credits or exports from your bill.
- Any notable weather events, shade changes, or maintenance performed.
- Panel level output if your system reports it.
- The calculated performance ratio if you have irradiance data.
After two or three years, patterns emerge. You will see the seasonal curve, the impact of a particularly hazy summer, and the underlying degradation trend. That trend is what you bring to a solar professional when you suspect a problem, and it is what transforms a vague complaint into a documented warranty issue.
Reading the Data: Warning Signs and False Alarms
Not every production dip means degradation. In fact, most short term drops are caused by something else entirely. Dust and pollen can cut output by 5 to 15 percent in dry climates until the next rain. Snow cover can zero out production for days. A new tree or a neighbor's new construction can introduce shade that did not exist at installation. Even a dirty inverter fan or a tripped breaker can look like degradation if you are only glancing at the app.
The warning signs that genuinely point to degradation include a steady downward trend across multiple years that exceeds the warranty curve, a single panel or string consistently underperforming its neighbors, and a sudden step change in output that does not correlate with weather. Hot spots, delamination, and browning of the backsheet are physical signs that often accompany electrical degradation, and they are worth a visual inspection at least once a year.
False alarms are common enough that it helps to have a triage process. Before assuming the worst, check whether the system was recently cleaned, whether any breakers tripped, whether the monitoring app itself updated or changed its reporting, and whether there was unusual weather in the comparison period. Only after ruling out those mundane causes should you start looking at the panels themselves.
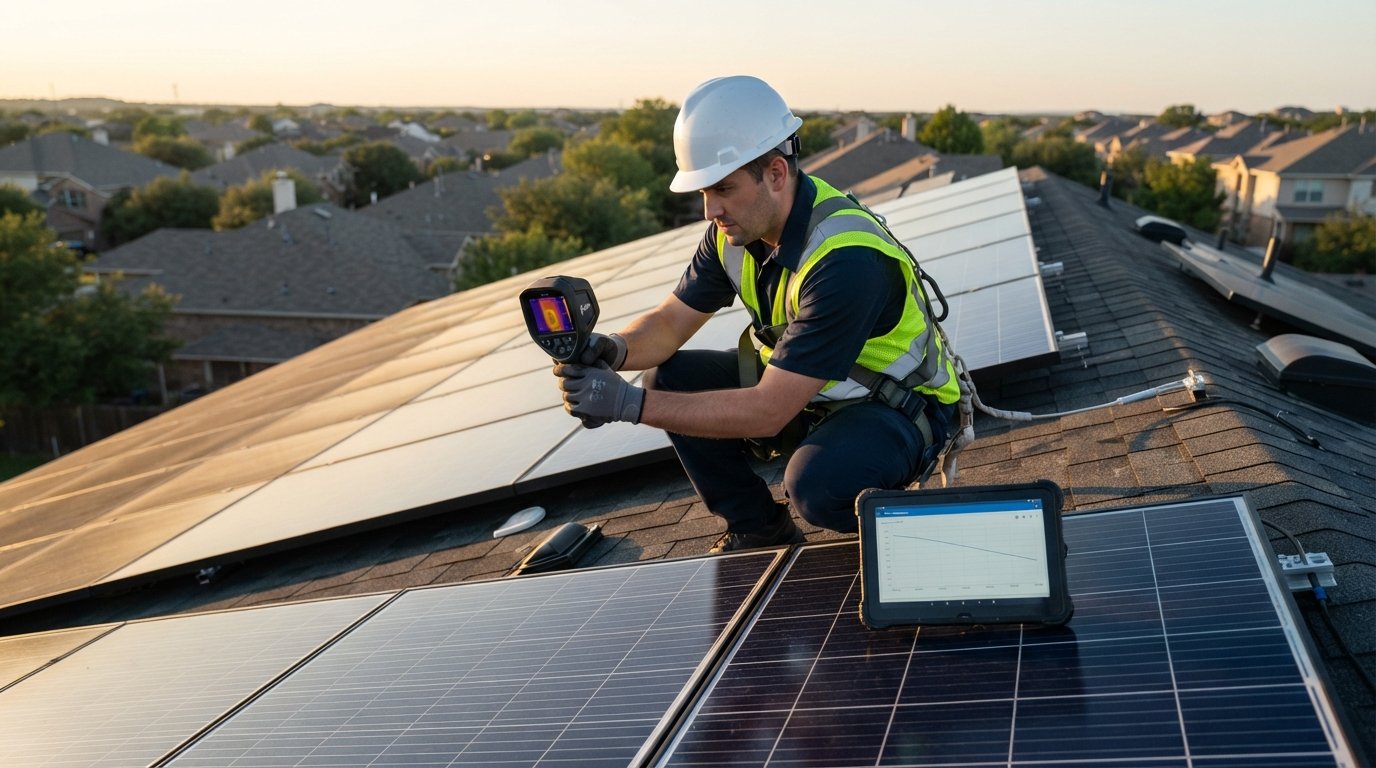
It also helps to know when professional diagnostics are warranted. If your performance ratio has dropped more than 10 percent from baseline and cleaning and shade checks do not explain it, it is time to call in a certified installer. They can perform IV curve tracing, thermal imaging, and string level testing that homeowner tools cannot replicate. If you do not already have a trusted installer, platforms that connect homeowners with vetted solar professionals can match you with local experts who handle exactly this kind of diagnostic work.
How to Use Monitoring Data for Warranty Claims and Repairs
Solar panel warranties are powerful, but they are also conditional. Most performance warranties require the owner to demonstrate that output has fallen below the guaranteed threshold, and that is where monitoring data becomes your best asset. A manufacturer will not accept a vague assertion that the system seems to produce less. They want dates, production figures, and ideally a third party verification.
When you file a claim, organize your evidence before you contact anyone. Gather monthly production data since installation, a summary of your calculated degradation rate, any panel level data showing which modules are underperforming, and records of maintenance and cleaning. If your installer performed any diagnostic testing, include those reports. The stronger your documentation, the faster the claim moves.
It is also worth understanding the difference between product warranties and performance warranties. Product warranties cover defects in materials and workmanship, typically for 10 to 25 years. Performance warranties guarantee a minimum output level over time. Degradation claims usually fall under the performance warranty, and they require proof that the shortfall is due to the panels themselves rather than the inverter, wiring, or installation. Monitoring data helps you make that distinction, which saves everyone time.
If a panel does need replacement, the monitoring history also protects you during the repair. It documents the system condition before the work, which prevents disputes about pre existing issues. And if you ever sell the home, that same history becomes a selling point, because buyers increasingly ask for production records when evaluating a solar equipped property.
Long Term Habits That Protect Your Solar Investment
Monitoring degradation is not a one time project. It is a habit, and like most habits, the value compounds. A system that gets checked monthly, cleaned when needed, and reviewed annually will almost always outperform a neglected one, both in raw production and in the owner's ability to recover costs when something goes wrong.
The most effective long term routine combines passive and active elements. Passive monitoring runs in the background through your inverter app or an AI platform, flagging anomalies automatically. Active monitoring is the annual review where you sit down with your production history, compare it to the warranty curve, and decide whether anything needs attention. Between the two, you get early warning without spending hours staring at charts.
It also pays to stay current on the broader solar landscape. Incentive programs, net metering rules, and utility rate structures change, and those changes affect the economics of your system as much as degradation does. Homeowners who want a straightforward way to compare installer options, calculate savings, and stay informed about renewable energy programs in the United States often start with independent resources like NewSolarQuotes, which offers guides and calculators alongside connections to local professionals. Pairing that kind of financial context with your technical monitoring data gives you the full picture of how your system is performing and what it is worth.
Finally, remember that degradation is normal. The goal is not to eliminate it, because you cannot. The goal is to measure it, catch anything abnormal early, and make sure the system delivers the savings you were promised. A few minutes each month, a clear baseline, and a willingness to act on warning signs will keep your array performing close to its potential for decades.
Learn more about Solar Panel Installation and Repair for guides, costs, and what to expect.
Compare Solar Panel Installation and Repair Pros Near You
Enter your ZIP code to compare top-rated local professionals and request free quotes.